Project Overview
In NCAA tournament lore, a Cinderella is a low-seeded team (seed 11–16) that defies odds to reach the Sweet 16 or further (requiring ≥2 wins). Historically, these upsets are treated as random chaos. We frame Cinderella prediction as a binary anomaly-detection problem, testing the hypothesis that team play-style profiles (tempo, three-point volume, effective FG%) carry predictive signals beyond public KenPom efficiency rankings.
To keep evaluation grounded, we enforce a strict chronological split (2003–2021 train, 2022–2026 test), apply SMOTE and scaling strictly inside CV folds to prevent data leakage, and establish a KenPom-only baseline.
Team Metric Adjuster
Tweak the team's regular-season statistical profile and observe the predictions change in real-time.
Model Probabilities
Evaluating 5 distinct classifiers simultaneously based on adjusted metrics.
Calculated Latent Style Factors
Projecting play-style metrics into 3 principal components (PCA) in real-time.
Calculated component...
Calculated component...
Calculated component...
Model Performance & Diagnostics
The classifiers are evaluated on held-out tournament seasons (2022–2026). Below is the comprehensive performance comparison against the baseline and diagnostic charts proving generalization.
| Model Name | Test F1-Score | Test Precision | Test Recall | Optimized Decision Threshold |
|---|---|---|---|---|
| Baseline (KenPom Rank Only) | 0.0870 | 0.0667 | 0.1250 | 0.717 |
| Logistic Regression (Full features) | 0.2128 | 0.1282 | 0.6250 | 0.597 |
| PCA + Logistic Regression | 0.2500 | 0.1562 | 0.6250 | 0.696 |
| Gradient Boosting Classifier | 0.2381 | 0.1471 | 0.6250 | 0.442 |
| Random Forest Classifier (Tuned) | 0.1786 | 0.1042 | 0.6250 | 0.356 |
Diagnostic Visualizations
1. Decision Threshold Sensitivity (Random Forest)
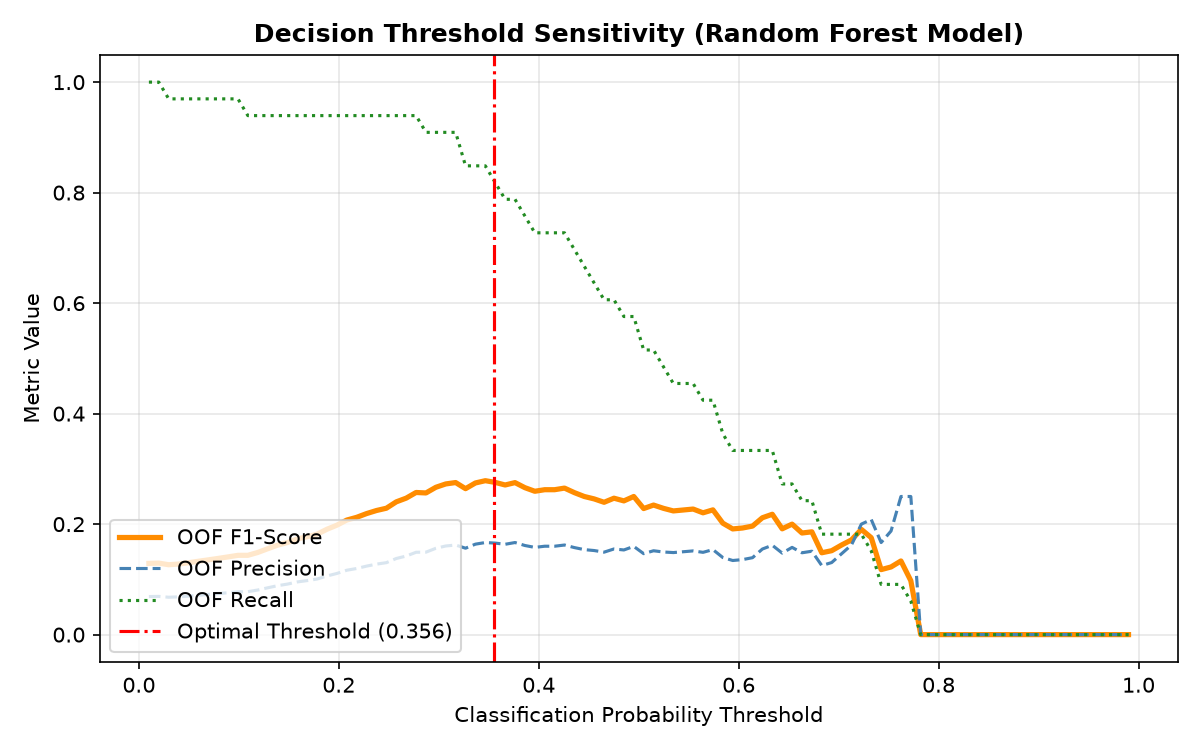
This sensitivity analysis sweeps the probability threshold from 0.01 to 0.99 using Out-Of-Fold (OOF) training data. By isolating predictions on training folds, we optimize the decision threshold without leaking test set statistics. The optimal threshold is selected at 0.356 (indicated by the red line), representing the point that maximizes the F1-score. The curve demonstrates the trade-off: higher thresholds yield higher precision at the expense of recall, whereas lower thresholds capture more Cinderellas but introduce false positives.
2. Parameter Sensitivity: F1 vs Random Forest Max Depth
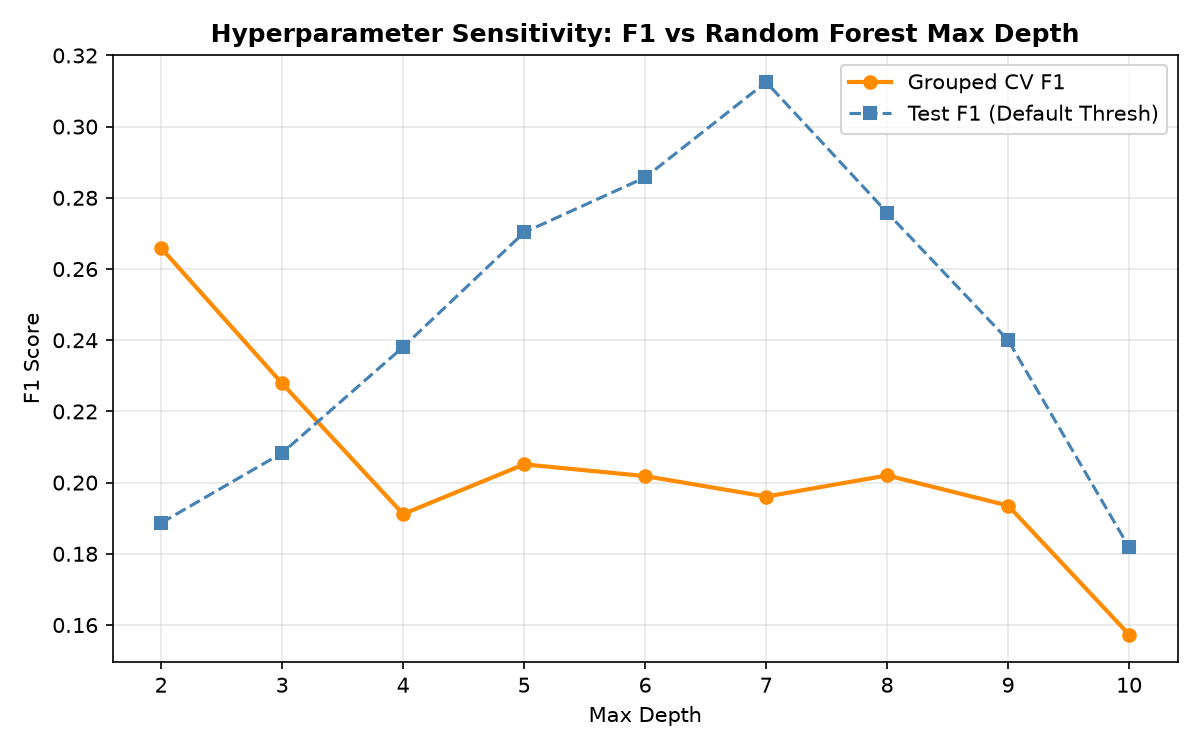
To address the hyperparameter sensitivity of our models, we sweep tree depth from 2 to 10. The Grouped CV F1 peaks at a depth of 3. Restricting tree capacity functions as an effective regularizer, preventing the Random Forest from over-fitting to the synthetic minority samples generated by SMOTE.
3. Test Set Confusion Matrix (Tuned Random Forest)
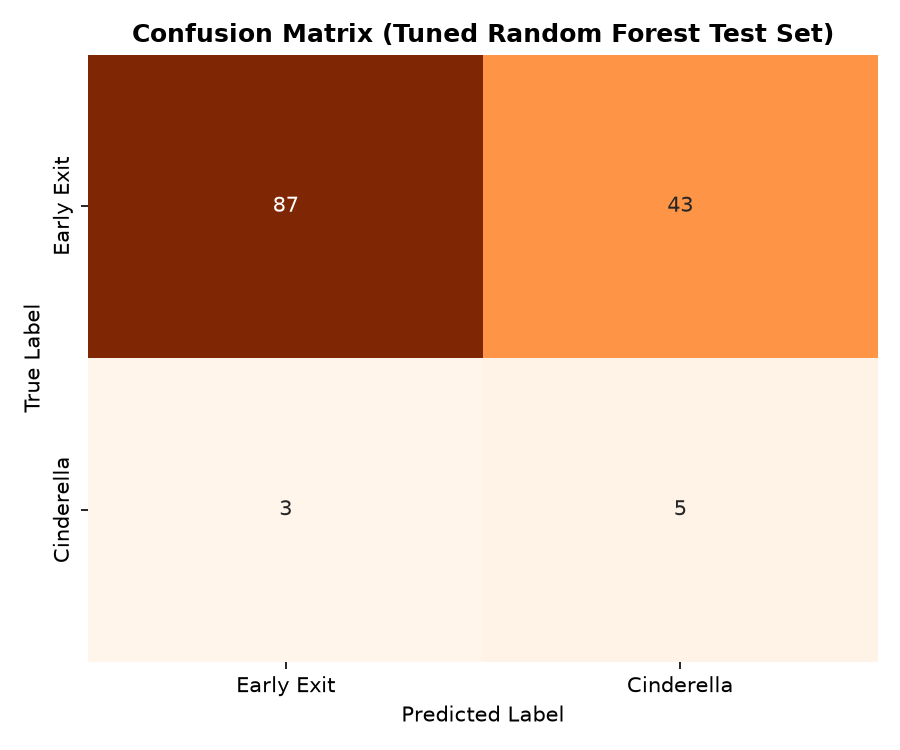
The confusion matrix evaluates model predictions on the held-out test years (2022–2026). Out of 138 low-seeded team-seasons, the model correctly isolates 5 of the 8 extremely rare Cinderella runs (62.5% recall), yielding a test F1-score of 0.1786. The majority of errors are false positives (exits predicted as Cinderellas), which is typical in rare-event classification due to class imbalance.
PCA Play-Style Loadings (Latent Factor Matrix)
To address high-dimensionality, we apply PCA to the 13 regular-season play-style features. Below are the coefficients (loadings) for the first 3 Principal Components:
| Feature Name | PC1 (Overall Quality) | PC2 (Pace & Perimeter) | PC3 (Possession security) |
|---|
Interactive Case Studies
Click a team to load its actual regular-season metrics into the Sandbox Adjuster above and examine what made them anomalies: